
Four product KPIs, total revenue, a payment-method breakdown, and a transactions chart—all on one screen. Pick day, week, month, year, or a custom range. The dashboard does the rest.
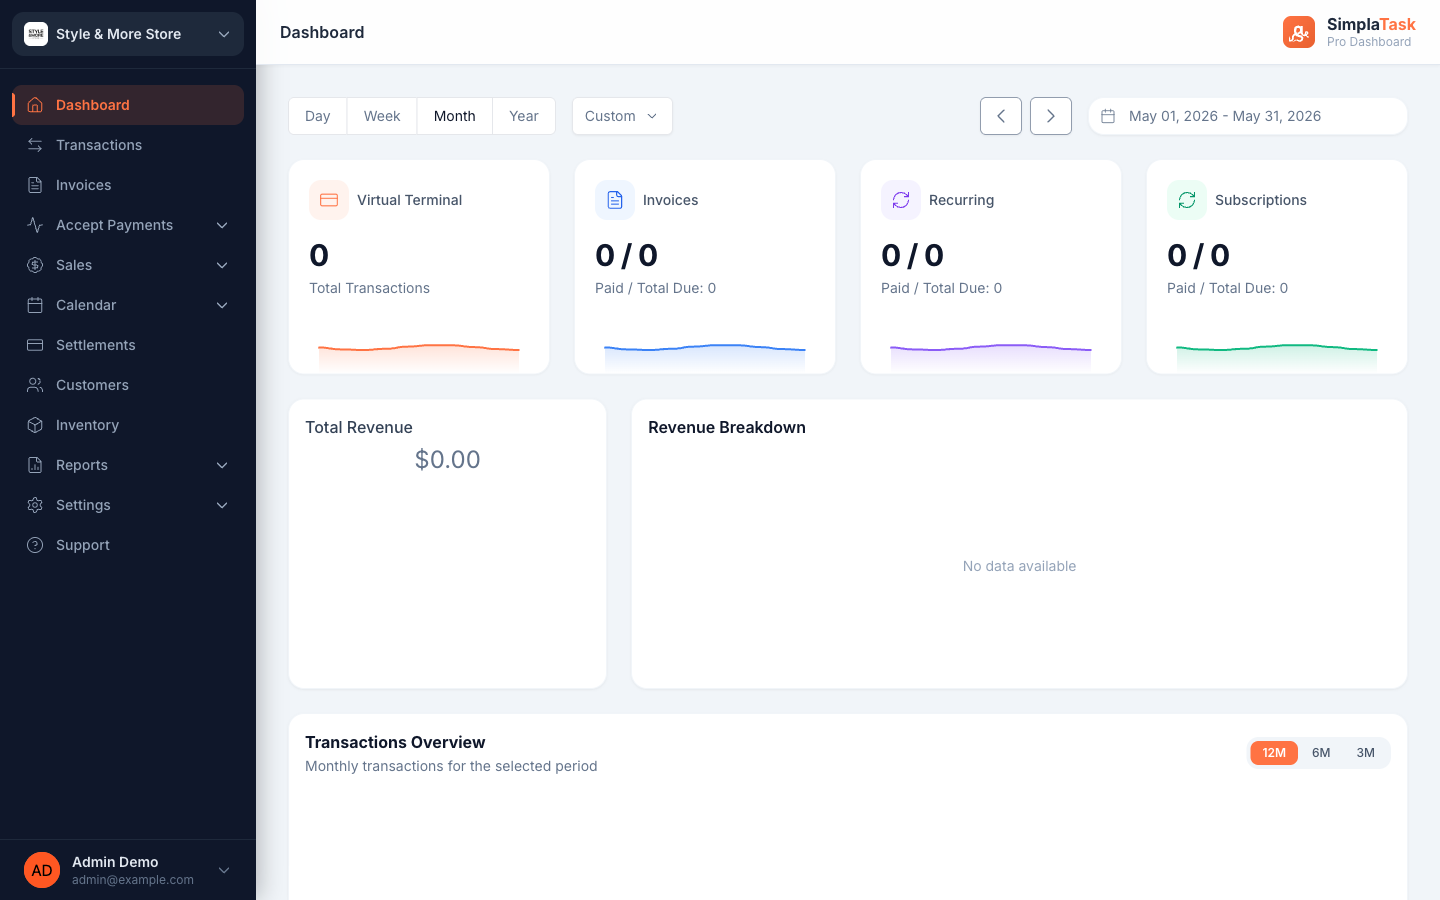
Each KPI maps to a product surface. Switch the date range and every card recalculates together.
Total transactions run through the virtual terminal in the selected range. Quick sanity check on day-to-day in-person sales.
Paid / Total Due ratio. See unpaid balance at a glance so you know who to follow up with this week.
Active recurring plans + balance due. Predict revenue without opening a spreadsheet.
Active members + next payments due. MRR-style monitoring without leaving the homepage.
Total Revenue and Revenue Breakdown panels sit below the KPI row. Below those, a Transactions Overview chart with 12M / 6M / 3M tabs.
The single number that matters most for the period you're looking at. Click through to drill into reports.
Sliced by source (Virtual Terminal vs Invoices vs Recurring vs Subscriptions) so you know where each dollar came from.
Time-series chart across 12, 6, or 3 months. Spot trends faster than any spreadsheet.
Need to drill deeper?
Open the Reports suiteOpen SimplaTask in the morning and you've got the day's snapshot. No spreadsheet, no export-and-pivot, no surprise weeks.